Funding Rate, Volume Price Scanner for Crypto Perpetual Futures
See Funding Rate, Volume and Price Action in One Screen.
Most traders don’t lose because the market is faster. They lose because the data is fragmented.
Funding Rate on one site. 24h volume on another. Price change somewhere else. By the time everything is checked, the move is already underway.
OMD Insights brings these critical derivatives signals together in a single dynamic dashboard — so you can scan faster, sort faster, and react with context.
One Dashboard. Multiple Critical Metrics.
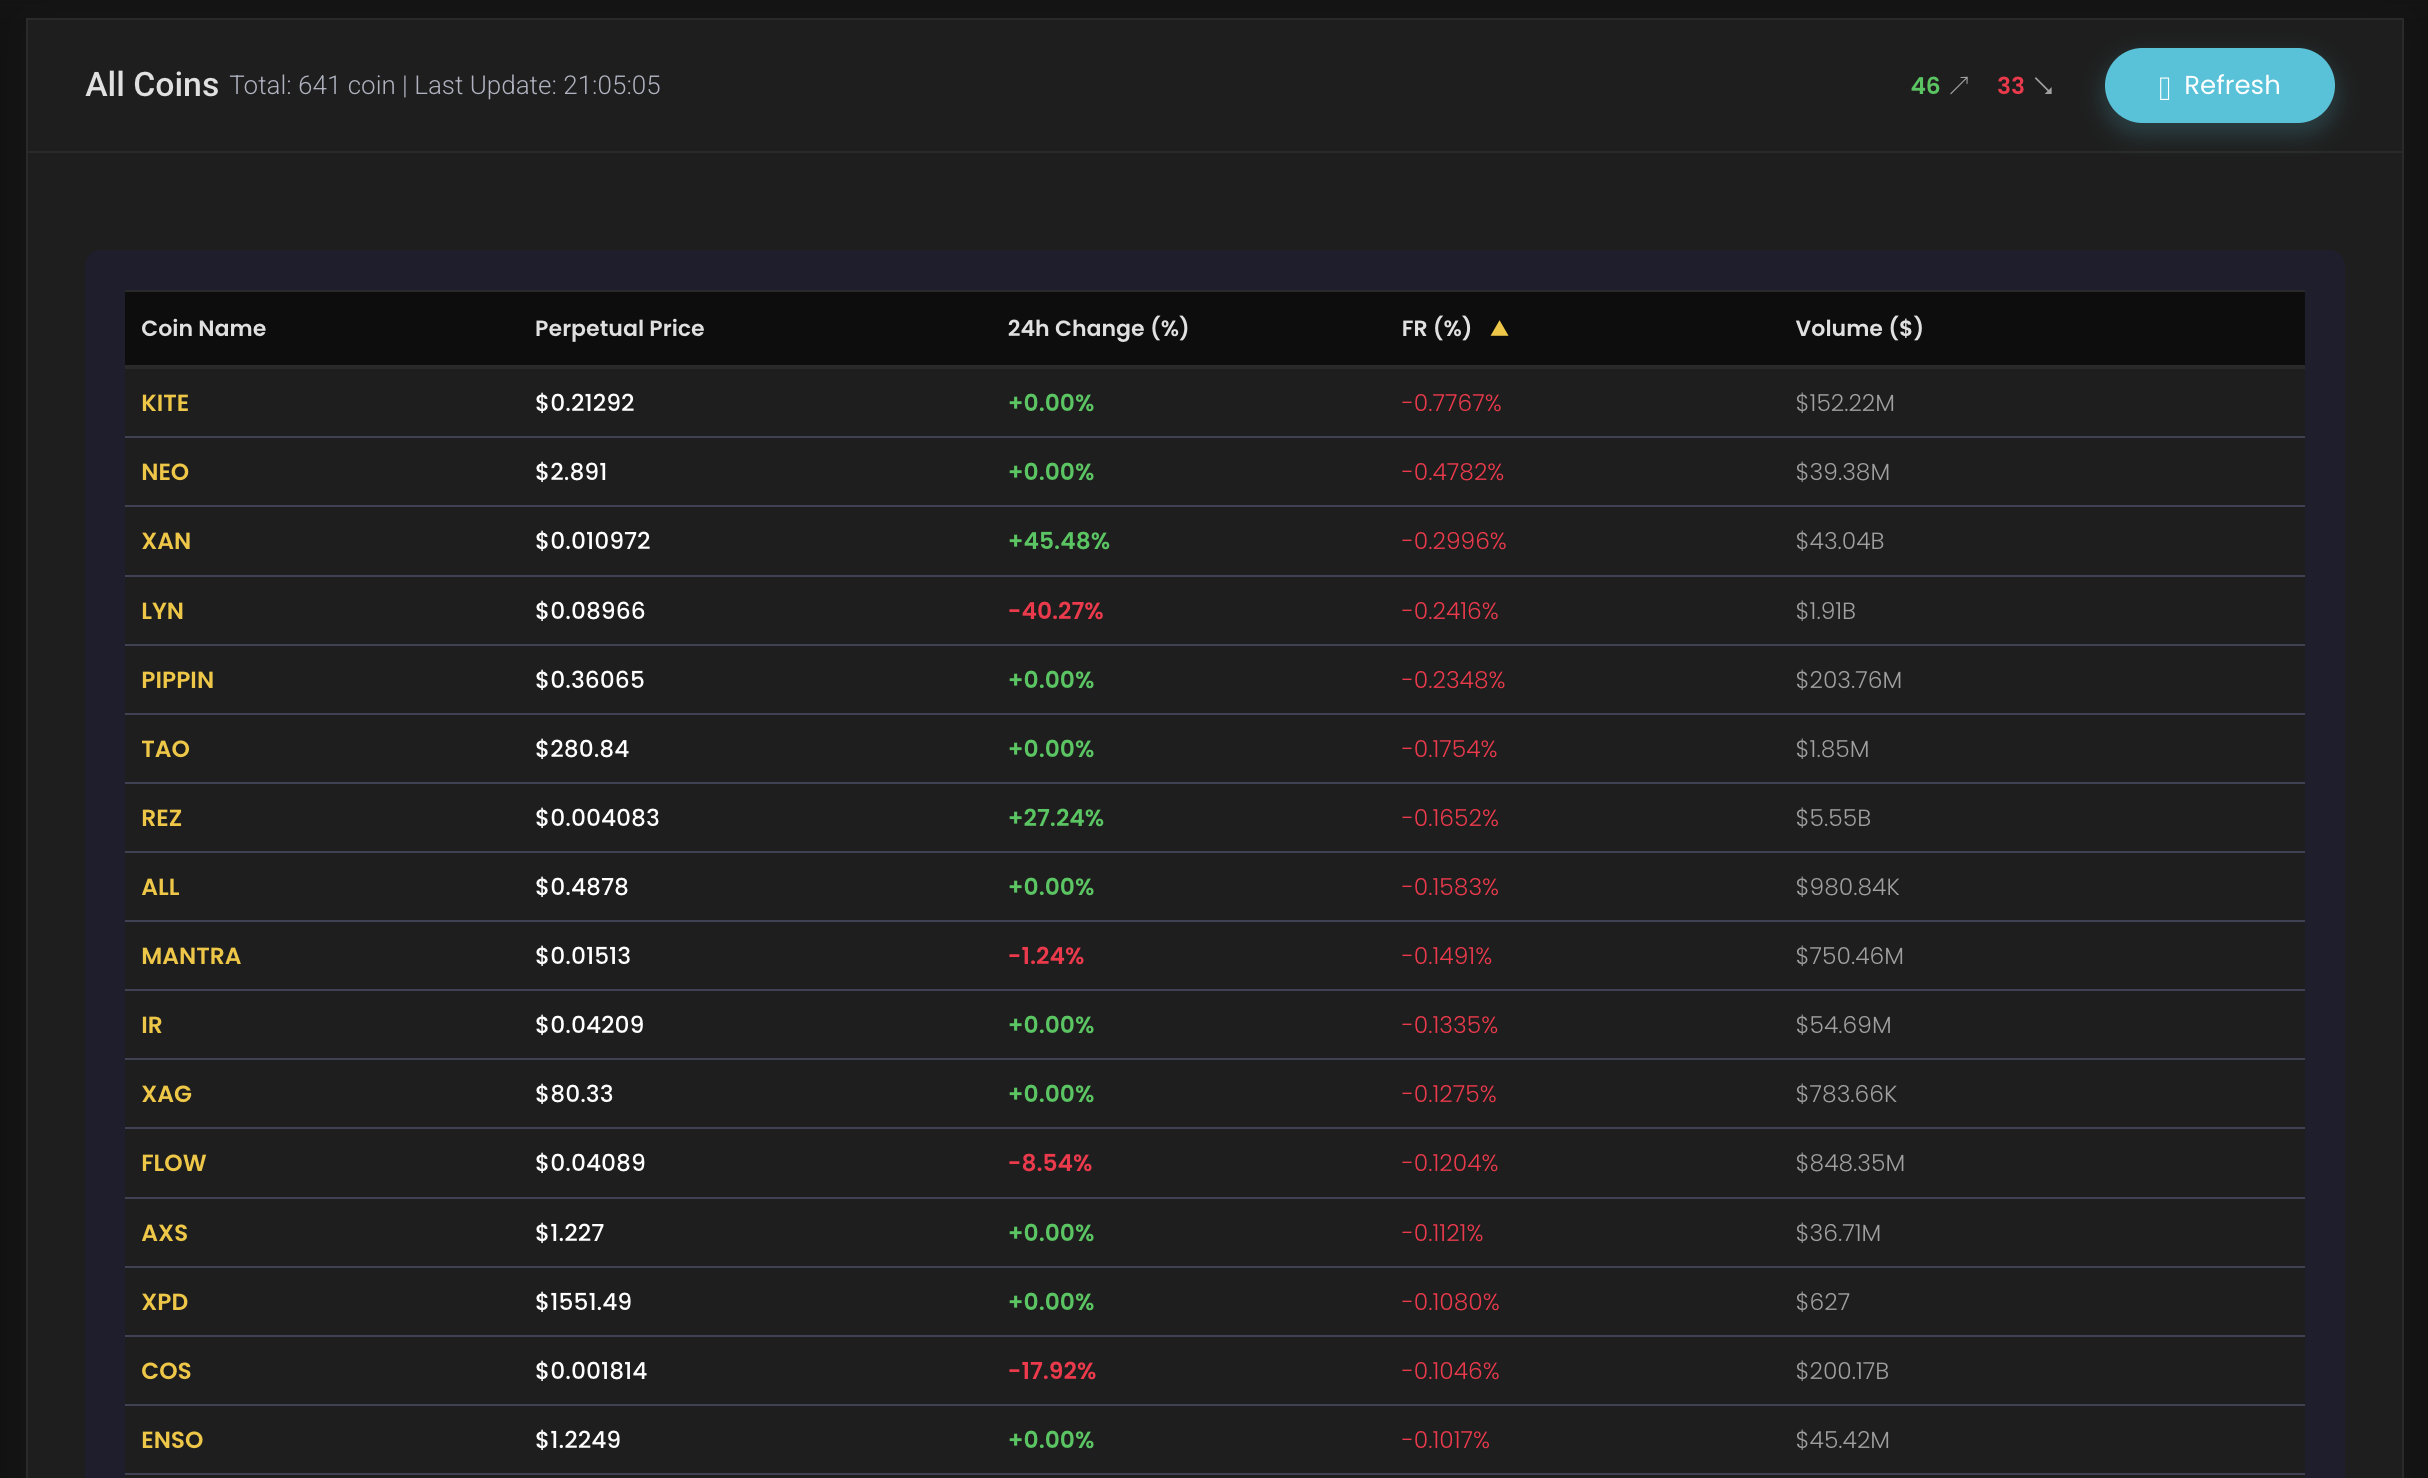
This screen allows you to monitor the market using four powerful variables in one sortable table:
- 💵 Perpetual price
- 📈 24h price change
- 📊 Funding Rate
- 📦 24h volume
Instead of switching between multiple platforms, you can evaluate positioning and momentum from a single dashboard view.
No tab-hopping. No manual filtering. No wasted time.
Sortable. Dynamic. Built for Fast Market Scanning.
Markets move fast. Your data layer should move faster.
With OMD Insights, you can sort the table instantly by:
- Funding Rate extremes
- Highest 24h volume
- Strongest price changes
- Perpetual market pricing
The page updates dynamically at regular intervals, helping traders stay aligned with changing market conditions without refreshing multiple screens manually.
Funding Rate Can Warn You Before the Crowd Sees the Move
Funding Rate is still one of the most underused metrics in crypto derivatives.
Most traders around the world still focus only on chart patterns and raw price action. But when Funding Rate starts reaching extreme levels, it often reflects crowd imbalance before volatility becomes obvious on the chart.
That matters. Because large pumps and dumps are often preceded by aggressive positioning.
When Funding Rate is tracked together with volume and price change, it becomes much easier to spot where pressure is building.
Smart traders don’t just watch candles. They watch positioning.
Why This Screen Matters
There are platforms that show Funding Rate. There are platforms that show volume. There are platforms that show price change.
But very few tools let you see all of them together in one clean, sortable, constantly updating screen.
That is exactly why this dashboard exists.
To give traders a faster way to scan the full market and identify where unusual activity is building.
Built for Traders Who Want Context — Not Noise
A single metric alone can be misleading. Funding Rate without volume can be incomplete. Price change without positioning can be deceptive. Volume without context can be random.
But when these variables are combined into one screen, patterns become easier to detect.
This is not about staring at more data. It’s about seeing the right data together.
Use It to Spot Market Pressure Faster
With this dashboard, traders can quickly identify:
- Coins with extreme Funding Rate imbalance
- Markets with unusually high 24h volume
- Strong price expansion already in motion
- Potential pump or dump conditions building beneath the surface
Instead of reacting late, you get a clearer view of where market pressure may already be forming.
Why Traders Use This Screen
This dashboard was built to reduce friction in decision-making by showing multiple high-value market variables together in one live view.
What you can monitor instantly
- Funding Rate extremes
- Volume expansion
- 24h market momentum
- Sortable market-wide comparisons
- Dynamic updates without manual refresh workflows
Market data should support decisions, not slow them down. This screen is designed to help traders scan more efficiently and identify unusual conditions earlier.